DVA
Dynamic Visibility Analysis
Can 3D Visibility Calculations Along A Path Predict The Perceived Density Of Pedestrians? The DVA starting point


A model, Based on the SOI, that predicts the perceived density of pedestrians walking along an urban rout.
In this case - The Rothchild boulevard in TA.
To simulate pedestrian visibility, we spread the viewpoints along a predefined rout.
Since visibility is directional: the 3D ray casting is in the walking direction.
That was the staring point of the Dynamic Visibility Analysis (DVA).
We conducted a systematic study: created 16 variant paths for the same location.
And measured their visibility
* The graphs show the visibility quantification along 100 viewpoints along the path
(just 2 examples out of 16 – an agent walking in the center of the boulevard and on the right an agent walking on the side-walk. Both with trees and low buildings).
Quantifying the accumulated lines of sight along a predefined route to each predefined category
Variables:
- Trees
- Building Height
- Orientation
- Direction of Movement
User Guide

Fisher-Gewirtzman D. “Can 3D visibility calculations along a path predict the perceived density of participants immersed in a virtual reality environment?” 11th Space Syntax Symposium, Lisbon (2017)
Perception of density by pedestrians on urban paths: an experiment in VR
An experiment where our participants ranked the perceived density of the same virtual environments based on manipulations of the Rothchild boulevard in TA.


Low building without trees
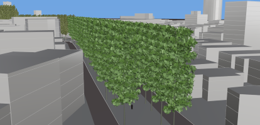
Low building with or without trees
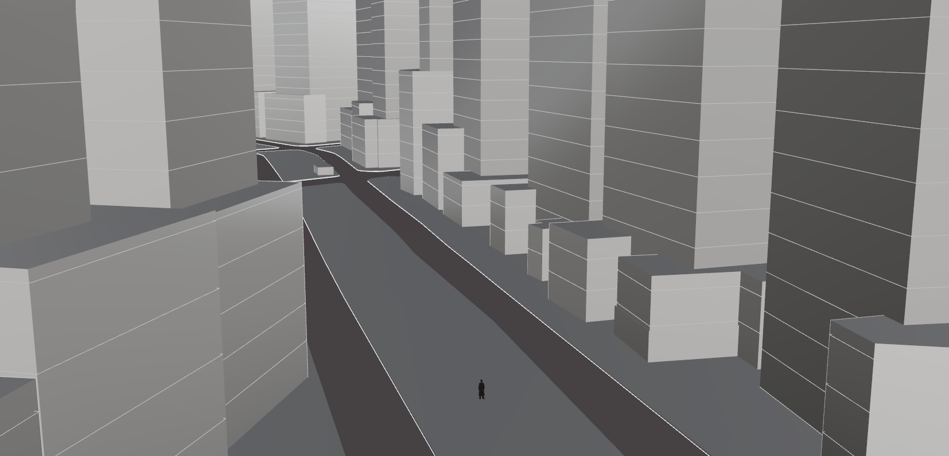
Tall buildings without trees
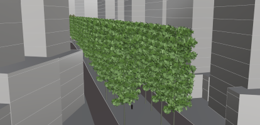
Tall buildings with trees

Rothschild Blvd
Tel-Aviv
Dafna Fisher-Gewirtzman (2018): Perception of density by pedestrians on urban paths: an experiment in virtual reality, Journal of Urban Design, DOI:10.1080/13574809.2018.1444471
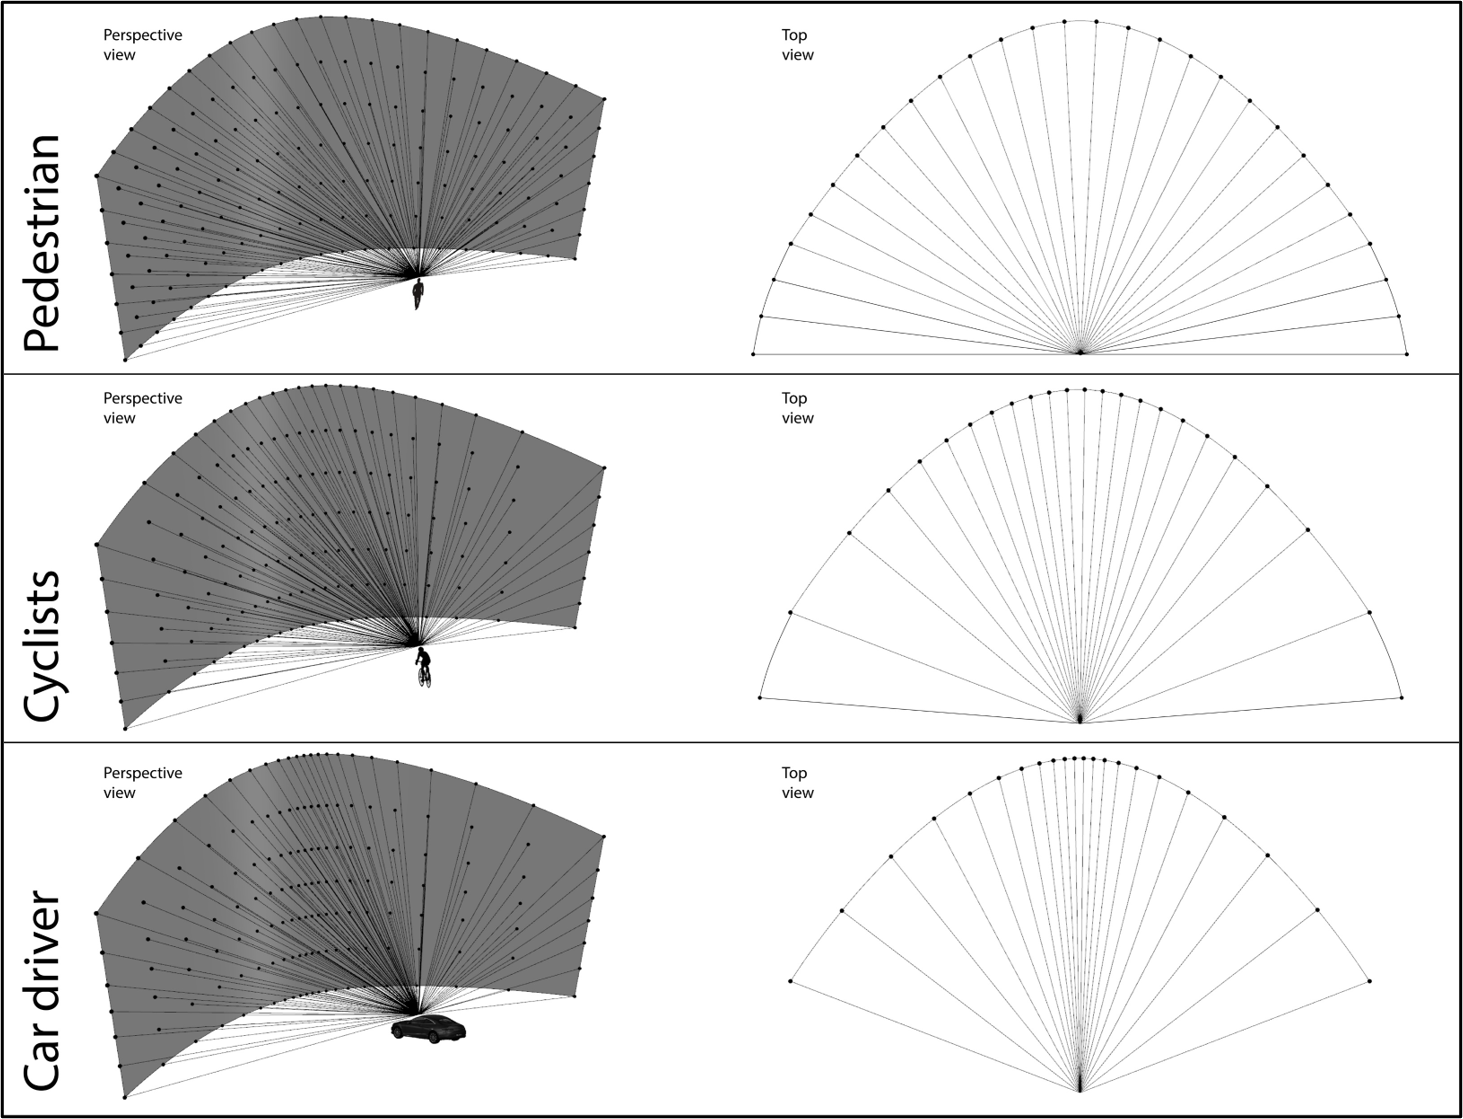
Dynamic Visibility Analysis (DVA) Simulating visual perception while using variant urban transportation modes
the model can be adjusted to variant urban transportation modes.
Such as cyclists and car drivers.
We had to consider different
- Height of viewpoint
- Field of view
- Location of route
- Number of sampling points, according to the difference in velocity.
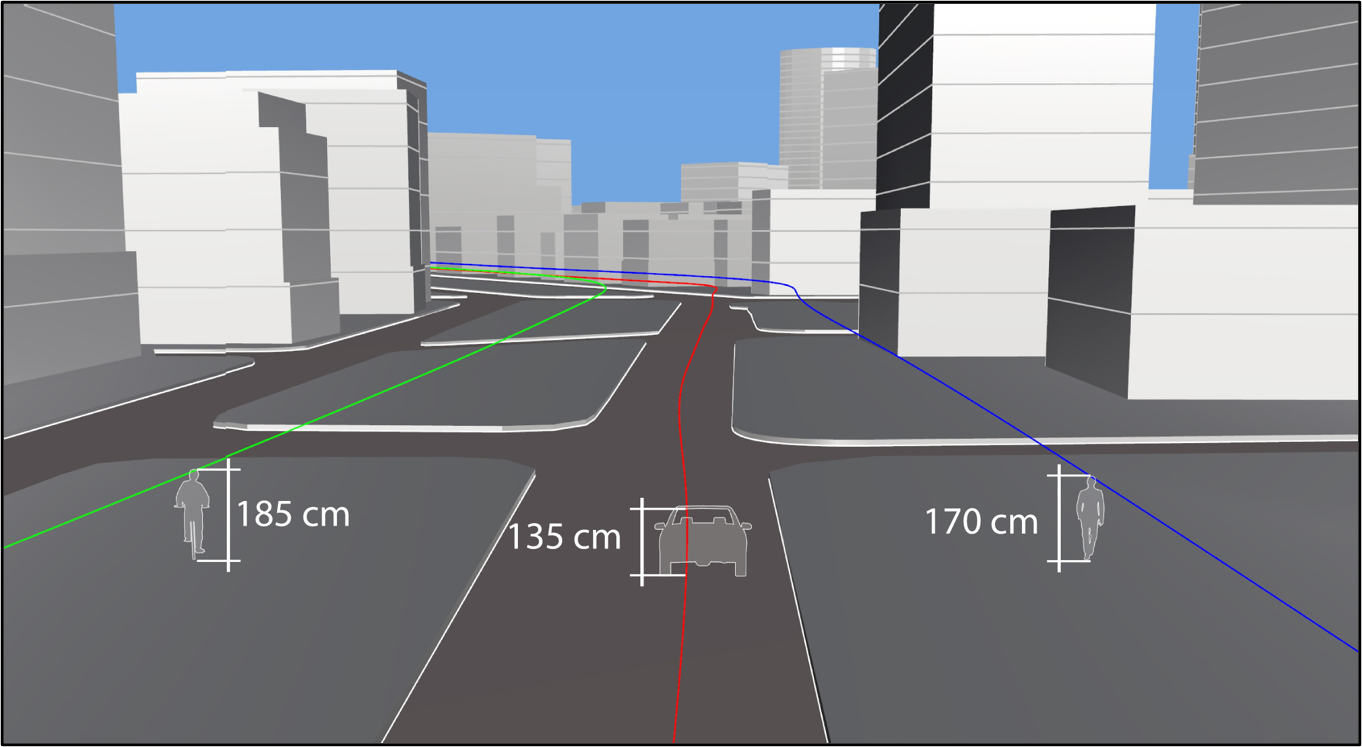
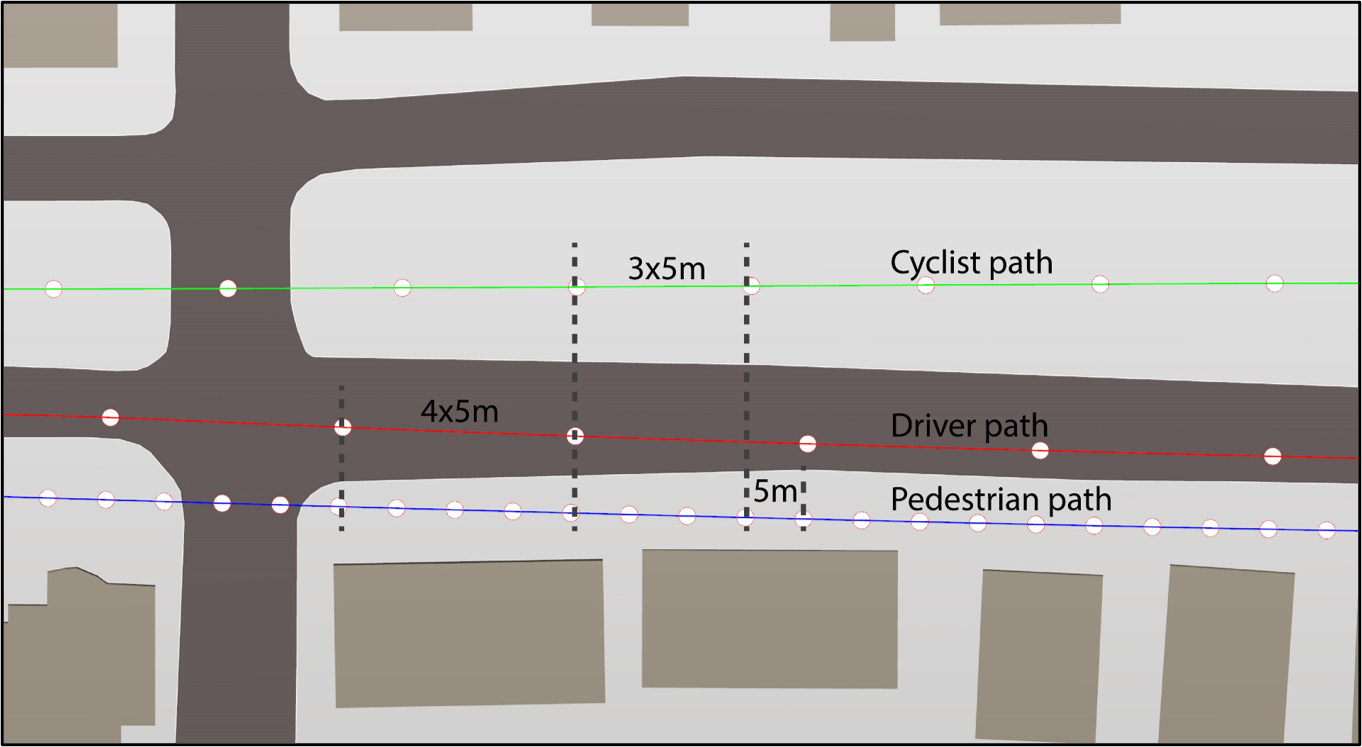
The ratio between distances was defined according to the differences in time, as defined in Google Maps


Dafna Fisher-Gewirtzman and Elad Bruchim, “Considering variant movement velocities on the 3D Dynamic visibility Analysis (DVA) Simulating the perception of urban users: pedestrians, cyclists and car drivers”. In Proceedings of eCAADe, 19-21 September 2018, Lodz, Poland.


